
Improving Build Time with Data
Engineering processes need data-driven optimization
During the beginning of my time at TripShot, I began to consider how to increase our Haskell build times. Shortly after, I found a tool for measuring GHC build times called time-ghc-modules.
I’m a huge fan of data-driven optimization efforts, so I immediately gave it a try. I didn’t know what I would find or if it would even help me ground my intuition about our build times. The rest of this article explains what I learned and, spoilers, how I cut our development build times in half!
Diagnosing the Problem
Everyone on our team uses unoptimized builds for day-to-day development. We typically add --fast to our stack build commands. The equivalent for cabal build would be --disable-optimization. This saves us a lot of time after git pulling the latest changes.
In terms of build time costs, I usually think of the following things first:
- Optimizations
- Fancy type system features
- Very large literals
- Template Haskell
I knew I could check off the first and last items because our team does unoptimized builds and for the most part our team avoids Template Haskell (after having some bad experiences with long build times). I couldn’t find any large literals so that left fancy type system features. So prior to running time-ghc-modules, I really expected to discover that we were spending significant time in the type checking phase.
The first thing I noticed when I looked at the output of time-ghc-modules was the amount of memory allocated during the build. I was shocked to see 2 terabytes of allocations.

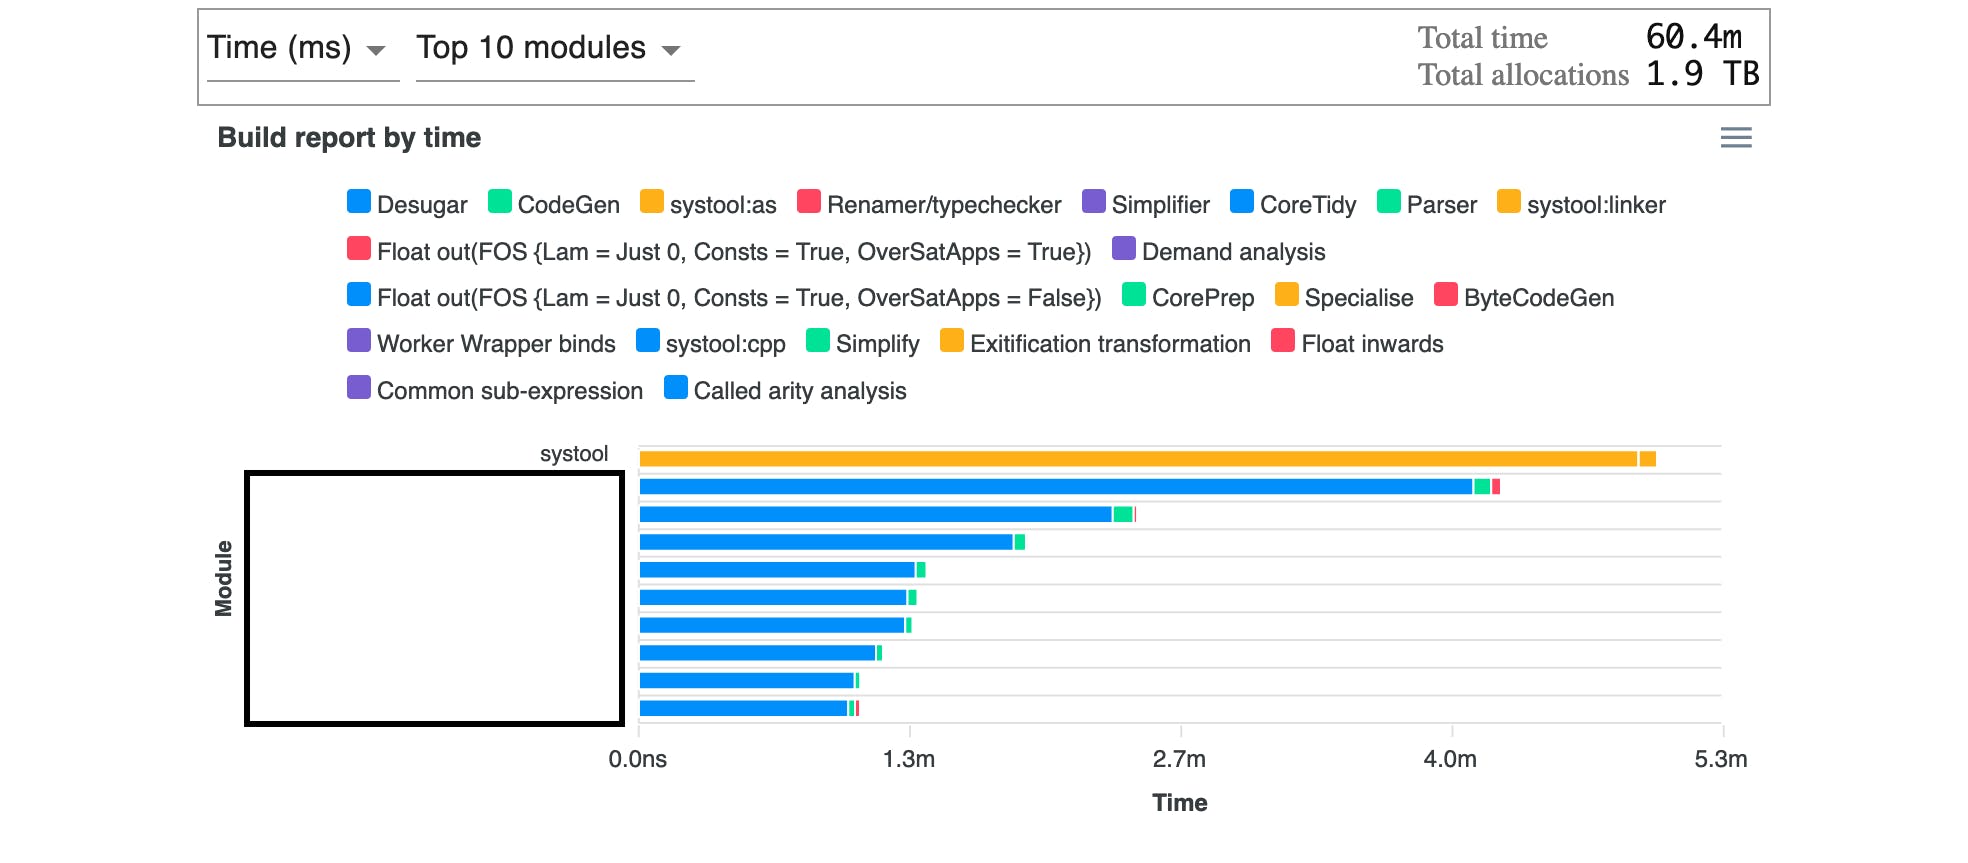
The next thing I noticed was that we spent a significant amount of time in the desugaring phase in many modules. This is also where most of the allocations were coming from. This must have put tremendous pressure on the GC and I suspect most of the time for desugaring is spent allocating and then collecting. Prior to this, I never really knew the breakdown of resources by compilation phase. I’ve since learned that this is a known costly phase.
At this point, I still didn’t know what the issue was but I had a way to measure it and I knew which modules were the worst offenders. I took one of these modules and started doing a bisection search for the issue. I created a new module and moved half the top-level definitions from the old module to the new module.
The new module still took much longer to build than I expected, so I repeated the process above but this time I moved half of the top-level definitions from the new module back to the old module. So now the new module had only 1/4 of the top-level definitions of the original. Each time I did this, I measured the build times again.
I repeated this process until I was down to a single definition, however, there was nothing special or noteworthy about the definition. It was an endpoint for our web server and contained relatively simple plumbing and calls to functions in other modules. At this point, I still had no idea what the problem was so I applied bisection search again, but this time I applied it by commenting out lines of code in the endpoint. Eventually, I narrowed it down to one line of code. Our endpoint was structured like this:
1someEndpoint :: ReaderT Env IO ()
2someEndpoint = do
3Env { .. } <- ask
4someDBOperation databaseHandle
We use record puns and wildcards, so the pattern match on Env introduces databaseHandle and any other fields of Env that the endpoint may need to reference. However, the costly line of code here was the Env pattern match. Including that line caused the compile-time to be measurable in seconds and removing it allowed the module to compile almost instantly.
I also tried replacing the pattern match above with an empty pattern match, Env {} <- asks, but to my surprise, it was just as costly in terms of compile-time as the example code above.
Potential Solutions
Now that I had isolated the issue, I needed a solution that wouldn’t be too disruptive to our code. Knowing that the issue was related to records, I did a few web searches and discovered Well-Typed’s work on large records. Sure enough, our Env type has over 30 fields and counts as a large record.
At the time, the large-records library required Template Haskell, and as I mentioned before I knew that wouldn’t be our first choice of solutions. However, applying that library to our code was easy and quick so I did a measurement using that library on our Env type.
Using large-records reduced the allocations by 1.5 terabytes and the total build time across all modules for an unoptimized build was cut in half. It’s worth noting that total build time is the sum of the build time for each module and shouldn’t be confused with the wall clock time for a parallel build.
The build time with large-records gave me a benchmark to shoot for as I tried other approaches.
Here is a non-exhaustive list of the options we came up with:
- Use the large-records library
- Use lenses or record selectors with asks
- Use HasField constraints
The main drawback to HasField is that we’re still using GHC 8.10.7 and the record field selector polymorphism related features are still evolving. I suspect this will be a good long-term solution for us once those things stabilize and we upgrade GHC versions. One of the potential advantages of this approach is that we could improve build parallelism if the endpoint modules do not know the concrete type of Env.
The main issue with defining lenses here, is that we would need to define one lens per field and each lens would look something like this:
1data Env = Env { databaseHandle :: DBHandle, {- many other fields -} }
2_databaseHandle :: Lens Env Env DBHandle
3DBHandle _databaseHandle = lens databaseHandle (\env h -> e { databaseHandle = h })
However, this is going to cause the module with these definitions to take a very long time to compile. Not only are we paying the quadratic cost of the large record itself, but defining a lens this way for each field will make us pay that cost again. If I’m not mistaken, GHC will actually do the quadratic expansion for each lens we define this way, making the actual cost cubic. When I tried this, the module took long enough to compile that I interrupted the build.
While having lenses for this type would be beneficial to us, we would need to define them some other way such as using one of the approaches Well-Typed recommends or the generic-lens package.
As a reminder, at the time we did this work large-records still required Template Haskell. So that really left our team with one solution that we liked. Using plain old record selectors and combining it with the asks function of the Reader monad.
Now instead of writing:
1someEndpoint :: ReaderT Env IO ()
2someEndpoint = do
3Env { .. } <- ask   someDBOperation databaseHandle
We would write:
1someEndPoint :: ReaderT Env IO ()
2someEndPoint = do
3dbHandle <- asks databaseHandle
4aDBOperation dbHandle
The drawbacks here are simple:
- We pay an upfront quadratic cost in the module that defines Env
- We have to find all occurrences of Env {..} and replace them with the appropriate asks
- The refactor took a while but was mostly automated with a combination of editor macros.
- Even though we’re still paying the quadratic cost where Env is defined, that cost is mostly in the noise for our build times and this refactor is essentially the same as the build time improvement we achieved with the large-records library.
Here you can see a before and after comparison:
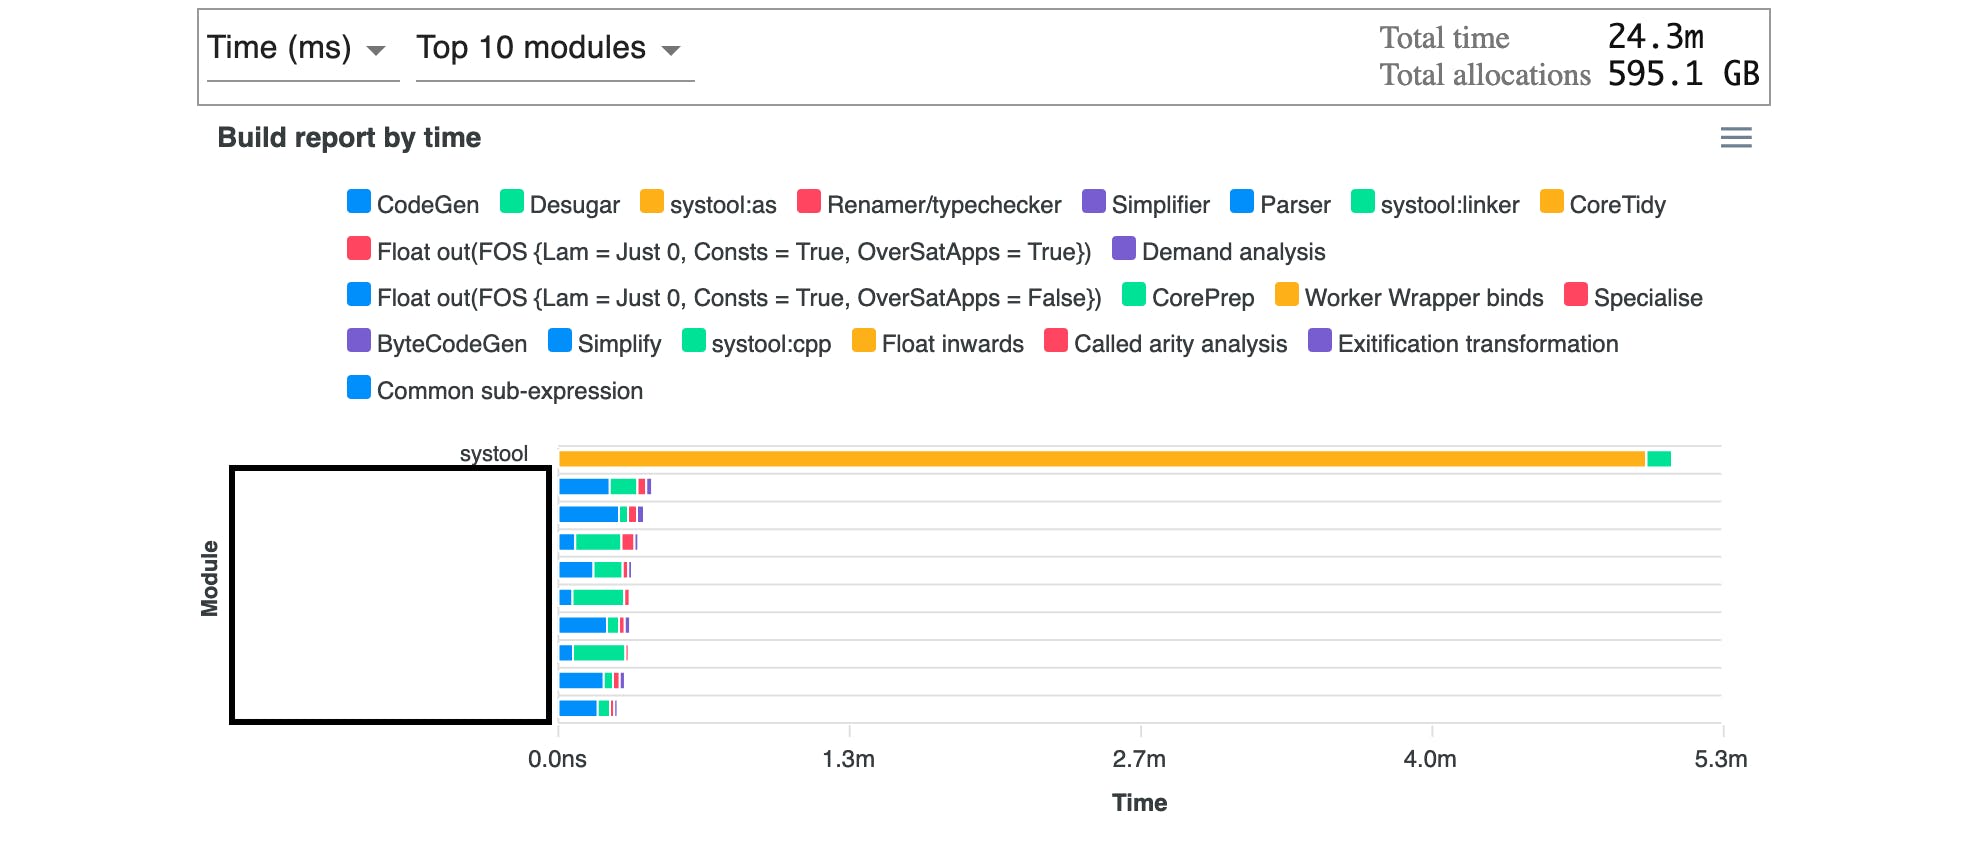
One last change we made was to include time-ghc-modules in our continuous integration system so that we can track changes in build time more easily in the future.
Conclusions for our Team
This refactoring gave us a huge speed up due to the structure of our code. We had one record that was used in hundreds of functions spread across many modules. So making even small changes to the cost of this abstraction gave a huge payout. In fact, the remaining build time for the desugaring phase is approximately 1/5th of the total remaining build time. We plan to optimize other large records in our code, but we’re already approaching a point of diminishing returns after addressing just the Env type. For me, this experience has further reinforced the idea that optimization is best done in a data-driven way. And of course, I now know to add large records to the list of things that cause long build times.
Recommendations
One of the issues we had with using time-ghc-modules is that it did not work out of the box on many of our dev machines. While it is a very pragmatic and useful tool, it is written as a shell script that makes a lot of assumptions about the environment it’s running in. We would love to see the community embrace time-ghc-modules and improve it. Rewriting it to be a portable Haskell program would probably be a good start. Or perhaps GHC could be taught to output this sort of report automatically?
The output could probably be improved a bit as well. For some queries, it’s necessary to export CSV from the generated HTML. However, the exported CSV only includes the data that’s currently displayed so you need to be careful to show all modules before exporting.
While Well-Typed has done some excellent work on the large records problem, until the solution is built into GHC, I fear that others will continue to rediscover the issue or, worse, be pushed away from Haskell by builds that use a lot of time and space. Echoing Stephen Diehl, I would love to see a version of GHC in 2030 that builds 5x faster with half the memory as 8.10.